
Free sample questions
3 questions from this set, shown in full with the correct answer and the reasoning behind it. Read them as a study resource.
Q1.The individuals chart below tracks the melt temperature on an extrusion line. No point falls outside the control limits, yet the technician stops the run and starts an investigation.
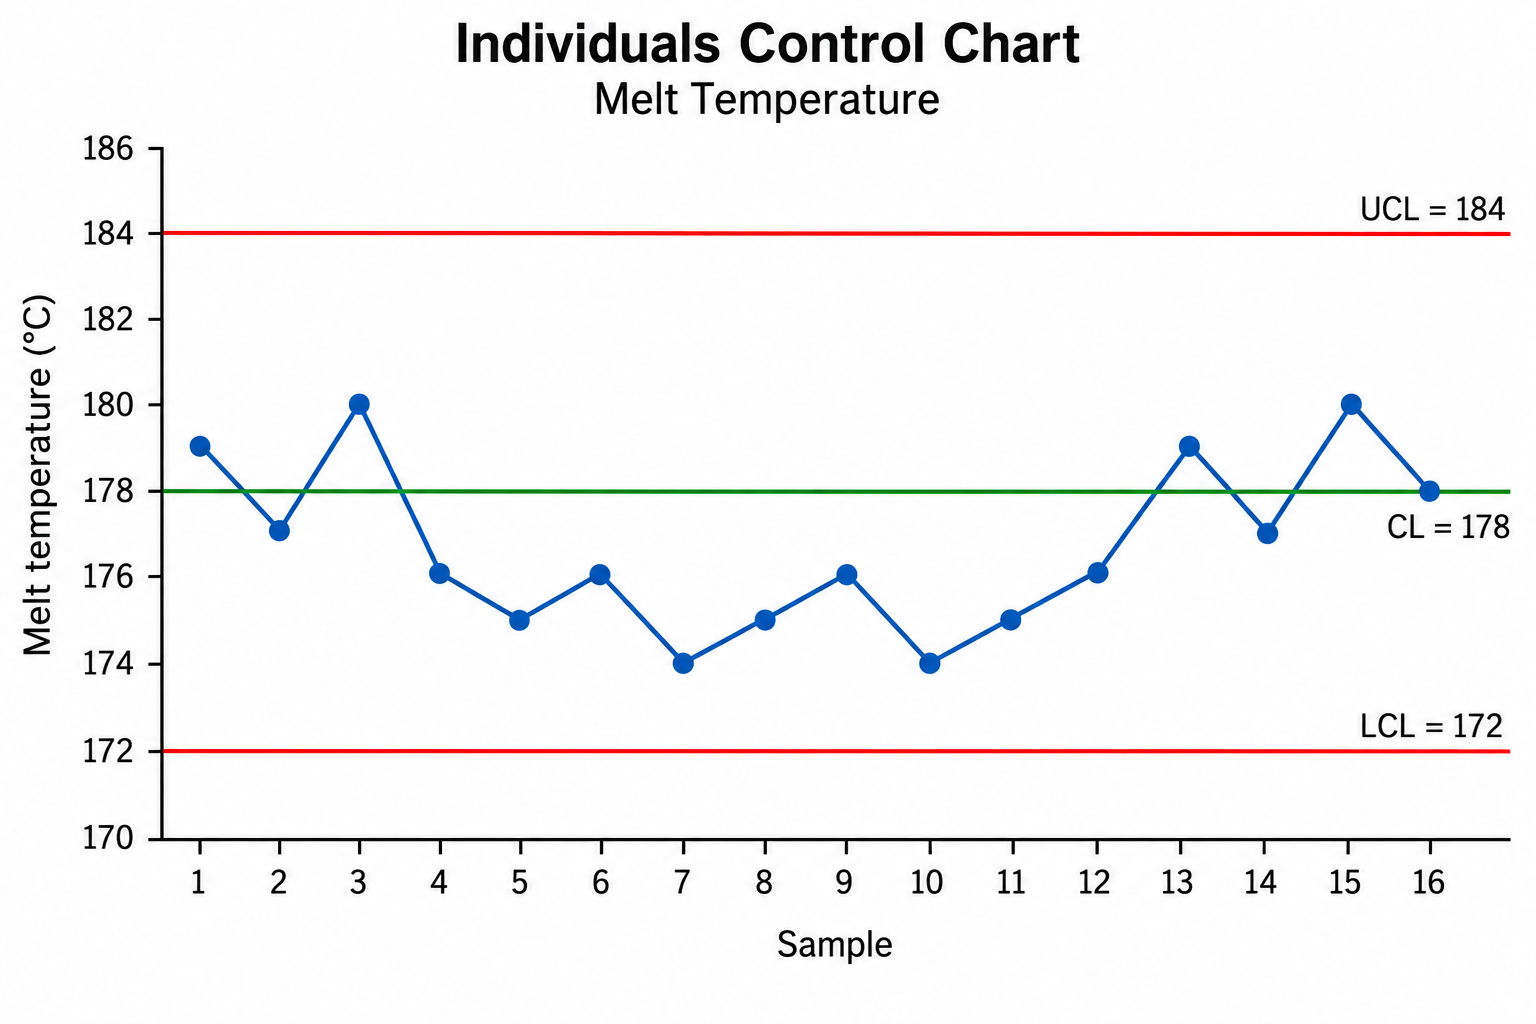
- A.Nine points in a row on one side of the centre line✓ Correct answer
- B.One point beyond three standard deviations above or below the centre line
- C.Six points in a row steadily rising or steadily falling
- D.Two out of three points in a row beyond two standard deviations
Explanation
Samples to are nine points in a row below the centre line, which is a run. A run says the process has settled at a new level, even though no point has crossed a limit. Looking only for a point outside the limits is the nearest wrong answer, and it is the habit this item is meant to break. A trend rule would need the points to climb or fall steadily, and these points scatter at a lower level instead.Reference: CQT BoK II
Q2.A cable assembly plant inspects exactly harnesses every hour. Until now the team recorded only how many harnesses were rejected. They now want the chart to show the total number of faults found each hour, because one harness can carry three or four separate faults.
Which control chart suits the new count?- A.p chart
- B.c chart✓ Correct answer
- C.np chart
- D.u chart
Explanation
The team is now counting faults, not faulty harnesses, and the amount inspected each hour is fixed at harnesses. A c chart plots the count of defects for a constant area of opportunity, so it fits. The u chart is the nearest rival: it plots defects per unit and is needed when the amount inspected changes from sample to sample, which is not the case here. The p and np charts both count defective units, which is what the team has decided to stop doing.Reference: CQT BoK II
Q3.A moulding process has been stable for a month. Its capability study gives and .
What does this pair of values show?- A.The process spread is too wide for the tolerance
- B.The process is not stable enough for capability to be judged
- C.The spread fits the tolerance, but the average sits off centre✓ Correct answer
- D.The measurement system is adding error to the readings
Explanation
of says the tolerance is comfortably wider than the natural spread of the process, so variation is not the problem. of is much lower, and the two indices separate only when the average drifts away from the middle of the tolerance. Blaming the spread is the nearest wrong answer, but a wide spread would have pulled down as well. Moving the process back to the centre would raise toward without any change to the equipment.Reference: CQT BoK II
Want the other 22 questions in CQT - 2. Statistical Techniques?
How well do you understand Statistical Techniques
- 25 exam-style CQT questions focused on Statistical Techniques
- Full explanation for every question
- Mobile friendly, no install required
- Instant feedback as you answer
Strengthen Your Understanding of Statistical Techniques
Preparing for the ASQ Certified Quality Technician (CQT) exam?
This paid 25-question practice quiz focuses specifically on Statistical Techniques, Section II of the CQT Body of Knowledge. The current CQT Body of Knowledge identifies Section II as Statistical Techniques.
The questions include a practical mix of:
- Basic statistical terminology
- Population and sample concepts
- Frequency distributions
- Measures of central tendency
- Measures of dispersion
- Normal distribution concepts
- Probability concepts
- Statistical inference
- Confidence levels and confidence limits
- Control charts
- Variable and attribute data
- Common-cause and special-cause variation
- Process capability
- Control limits and specification limits
- Data plotting and interpretation
- Short calculations
- Practical quality-control scenarios
- Plausible distractors based on common misunderstandings
Learn from Every Question
This quiz is offered in Review Mode, so you will see the correct answer and a clear explanation immediately after each response.
Each explanation helps you understand:
- Why the correct answer is right
- Which statistical concept or technique is being tested
- Why the other options are less appropriate
- How the concept applies in a practical quality technician situation
- How similar concepts may appear in a CQT-style question
The goal is not simply to check your score. It is to help you understand how statistical techniques are used to summarize data, recognize variation, monitor processes, evaluate capability, and support quality decisions.
Part of the Paid CQT Practice Package
This 25-question quiz is included in the complete CQT Practice Test Package.
Use it to:
- Strengthen your understanding of basic statistics
- Interpret measures of central tendency and variation
- Apply probability and normal distribution concepts
- Read and interpret control charts
- Distinguish common-cause from special-cause variation
- Understand process capability
- Interpret data and perform basic calculations
- Improve your readiness for the CQT exam
Ready to Test Your Statistical Techniques Knowledge?
Complete the 25-question Review Mode quiz and use every incorrect answer as a guide for further study.
Start the CQT Statistical Techniques Practice Quiz
What this quiz covers
- Statistical Techniques
Questions about this practice test
Related CQT practice tests
- CQT Free Practice Questions (Review Mode)25 practice questionsReviewFreeView quiz
- CQT Full 100 Randomly Drawn Questions Mock Exam (240 Minutes)100 practice questionsExam · 240 minView quiz
- CQT Free Mock Exam (60 Minutes)25 practice questionsExam · 60 minFreeView quiz
- CQT - 1. Quality Concepts and Tools25 practice questionsReviewView quiz
Want the full course, not just the questions?
Quality Gurus video courses cover the whole body of knowledge with worked examples, templates and downloadable notes — taught by Sandeep Kumar.
Browse Quality Gurus courses