
Free sample questions
4 questions from this set, shown in full with the correct answer and the reasoning behind it. Read them as a study resource.
Q1.A plant reports mean cycle time separately for three shifts. The shifts did not produce the same number of units.
What is the mean cycle time across all units produced that day?- A.9.5 minutes✓ Correct answer
- B.11.0 minutes
- C.8.0 minutes
- D.12.5 minutes
Explanation
Three shift means cannot be averaged directly when the shifts made different numbers of units. Each mean has to be weighted by its own unit count:
Substituting the shift figures:
11.0 minutes is the trap. It is the plain average of the three shift means, which treats the 20-unit shift as equally important as the 120-unit shift. 12.5 minutes applies the same weights to the wrong shifts.Reference: CSSYB BoK III
Q2.The histogram below shows order fulfillment time for 200 orders.
Which ordering of the three measures of central tendency is correct for this distribution?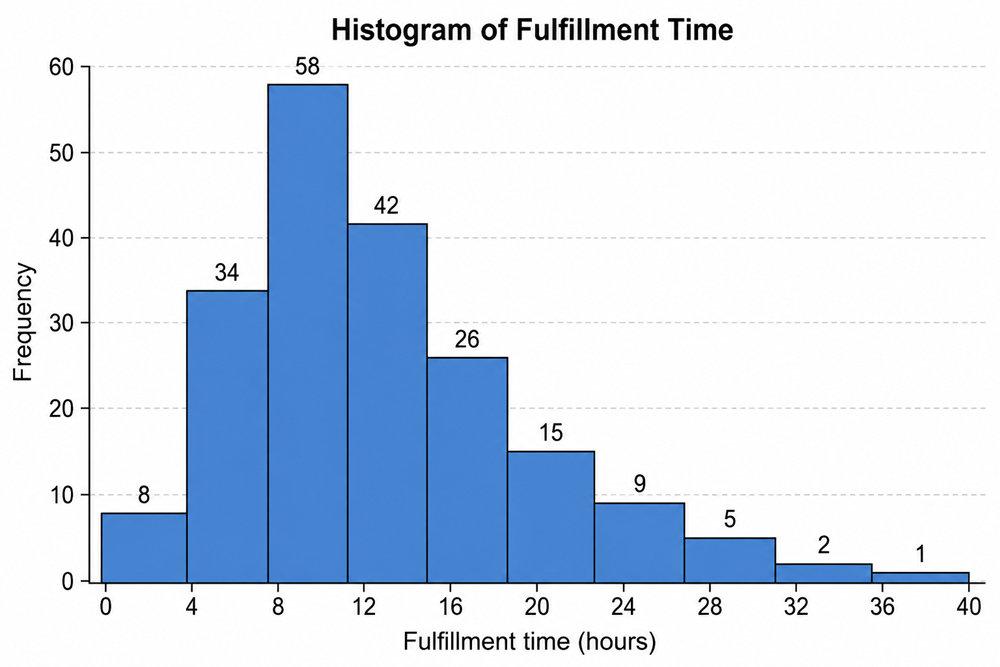
- A.Mean is lowest, median is in the middle, mode is highest
- B.Mean, median and mode all fall at the same value
- C.Mode is lowest, median is in the middle, mean is highest✓ Correct answer
- D.Median is lowest, mode is in the middle, mean is highest
Explanation
The long tail runs to the right, so this distribution is right skewed. The mode is the tallest bar, so it sits at the peak, which is on the left. The mean uses every value, so the few very long fulfillment times in the tail pull it to the right, away from the peak. The median lands between the two. The order is mode, then median, then mean. Reverse the picture and the order reverses too: in a left skewed distribution the mean is lowest. Only a symmetric distribution puts all three at the same value.Reference: CSSYB BoK III
Q3.A gauge is checked against three certified reference standards. Each standard is measured ten times and the average reading is recorded.
What does this result show?- A.A linearity problem, because bias appears at every reference value
- B.A constant bias across the range, with acceptable linearity✓ Correct answer
- C.A stability problem, because the readings differ from the references
- D.A repeatability problem, because ten readings were needed at each point
Explanation
Bias is the difference between the average reading and the true value. Here it is mm at every reference, so the gauge reads high by the same amount everywhere. Linearity asks a different question: does the bias change as you move across the operating range? It does not change here, so linearity is fine. A gauge with good linearity and a constant offset is the easy case, because a calibration adjustment removes the whole mm. Stability would require readings taken at different times, and repeatability would require looking at the spread of the ten readings rather than their average.Reference: CSSYB BoK III
Q4.The data collection form below was used by inspectors on a painted door panel line for one week.
What does this form show the team that a plain defect count would not?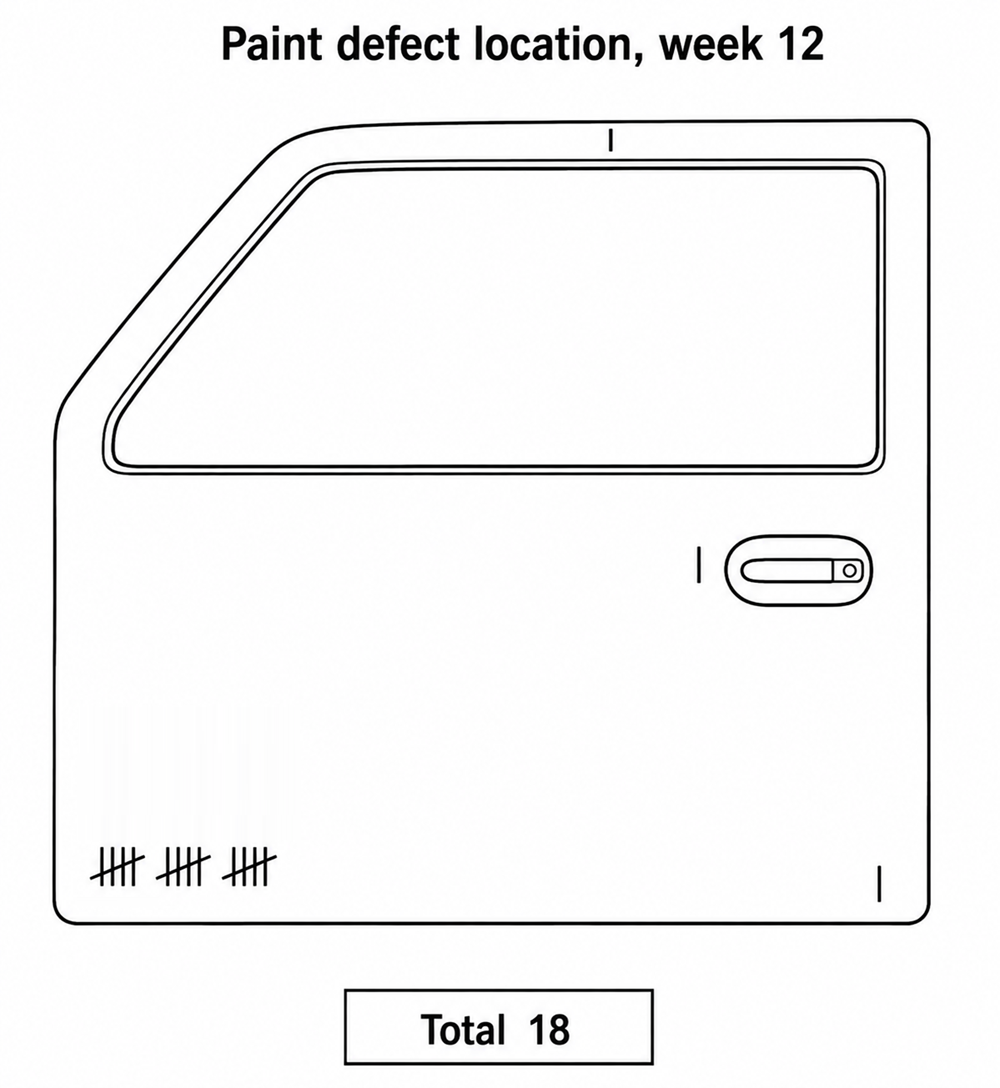
- A.Which defect type occurs most often, ranked from largest to smallest
- B.Where on the part the defects occur, which points toward a physical cause✓ Correct answer
- C.How the defect rate changed from one day to the next during the week
- D.Whether the difference between the inspectors is statistically significant
Explanation
This is a defect location check sheet, sometimes called a concentration diagram. The marks are made on a picture of the part, so the pattern of where defects land is the data. Fifteen of the eighteen defects in one corner is a strong physical clue: something contacts, drips onto or masks that corner. A running total of 18 defects would never reveal it. Ranking defect types is what a Pareto chart does, and changes over time need a time axis, which this form does not have.Reference: CSSYB BoK III
Want the other 21 questions in CSSYB - 3. Measure Phase?
How well do you understand Measure Phase
- 25 exam-style CSSYB questions focused on Measure Phase
- Full explanation for every question
- Mobile friendly, no install required
- Instant feedback as you answer
Strengthen Your Understanding of the Measure Phase
Preparing for the ASQ Certified Six Sigma Yellow Belt (CSSYB) exam?
This paid 25-question practice quiz focuses specifically on the Measure Phase, Section III of the CSSYB Body of Knowledge.
The questions include a practical mix of:
- Purpose of the Measure phase
- Process mapping and process understanding
- Data collection planning
- Types of data
- Measurement scales
- Operational definitions
- Basic measurement concepts
- Data accuracy and consistency
- Basic descriptive statistics
- Mean, median, mode, and range
- Variation and standard deviation concepts
- Process performance measures
- Defects and defect opportunities
- Yield and basic process metrics
- Basic measurement system concepts
- Workplace-based scenarios
- Short calculations
- Plausible distractors based on common misunderstandings
Learn from Every Question
This quiz is offered in Review Mode, so you will see the correct answer and a clear explanation immediately after each response.
Each explanation helps you understand:
- Why the correct answer is right
- Which Measure phase concept is being tested
- Why the other options are less appropriate
- How the concept applies in a practical Six Sigma project
- How similar concepts may appear in a CSSYB-style question
The goal is not simply to check your score. It is to help you understand how the Measure phase establishes reliable data, describes current process performance, and provides a factual baseline for further analysis.
Part of the Paid CSSYB Practice Package
This 25-question quiz is included in the complete CSSYB Practice Test Package.
Use it to:
- Strengthen your understanding of the Measure phase
- Improve your ability to plan and collect useful data
- Distinguish between different data types and measurement scales
- Practise basic statistical calculations
- Understand variation and process performance measures
- Reinforce basic measurement system concepts
- Apply Measure phase concepts to workplace situations
- Improve your readiness for the CSSYB exam
Ready to Test Your Measure Phase Knowledge?
Complete the 25-question Review Mode quiz and use every incorrect answer as a guide for further study.
Start the CSSYB Measure Phase Practice Quiz
What this quiz covers
- Measure Phase
Questions about this practice test
Related CSSYB practice tests
- CSSYB Full 80 Randomly Drawn Questions Mock Exam (120 Minutes)80 practice questionsExam · 240 minView quiz
- CSSYB Free Mock Exam (60 Minutes)25 practice questionsExam · 60 minFreeView quiz
- CSSYB Free Practice Questions (Review Mode)25 practice questionsReviewFreeView quiz
- CSSYB - 1. Six Sigma Fundamentals25 practice questionsReviewView quiz
Want the full course, not just the questions?
Quality Gurus video courses cover the whole body of knowledge with worked examples, templates and downloadable notes — taught by Sandeep Kumar.
Browse Quality Gurus courses